


View the most recent version.
Archived Content
Information identified as archived is provided for reference, research or recordkeeping purposes. It is not subject to the Government of Canada Web Standards and has not been altered or updated since it was archived. Please “contact us” to request a format other than those available.

As Canada celebrates its 150th anniversary, the country is expecting an increase in international attention, including international visitors. This month’s issue of Canadian Megatrends takes a historical look at Canadian tourism, describing the long-term changes in who has been visiting Canada—and where Canadians have been visiting.
Over the past several decades, increasing numbers of travellers from a growing variety of countries have been making Canada their destination for business or pleasure.
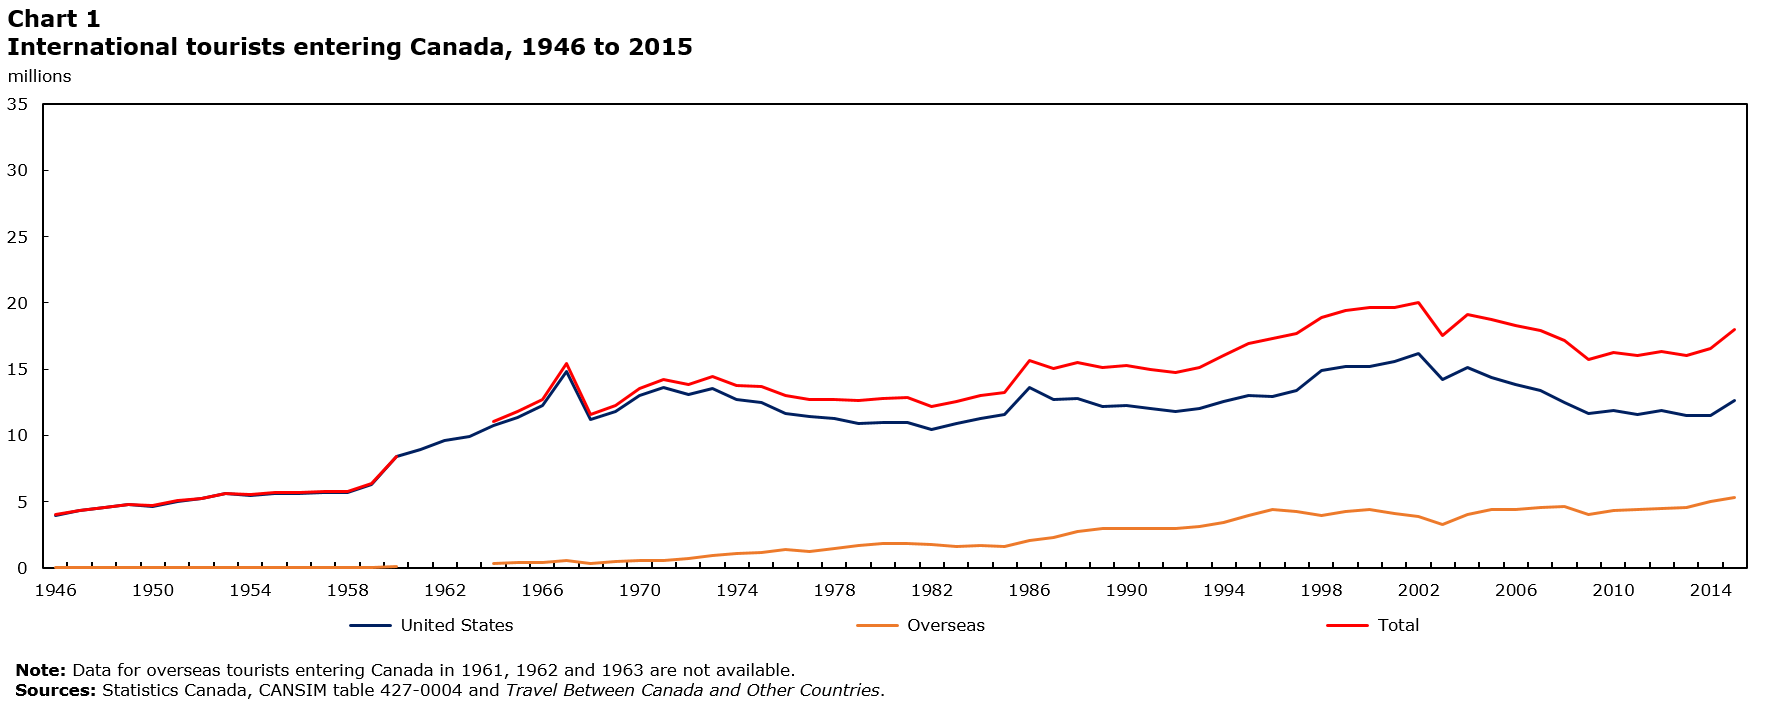
In the 1950s, nearly every tourist entering Canada came from the United States. The shared border with the United States remains important to the Canadian tourism industry; however, in 2015, 3 in 10 tourists came from elsewhere in the world.
International tourists visiting Canada
In 1946, about 4 million tourists visited CanadaFootnote 1. Over the next two decades, that number nearly quadrupled, reaching more than 15 million in 1967, the year Canada celebrated its centennial anniversary and Montréal hosted Expo 67. Much of the increase over this period can be attributed to the rapid rise in commercial air travel, which took off in the late 1950s and expanded further in the late 1960s.
Starting in 1968, the number of visitors continued to rise—albeit at a slower rate—until 2002, when more than 20 million tourists visited Canada. This was followed by a period of decline, due almost entirely to a decrease in the number of tourists from the United States. Several factors likely influenced the decline, including the SARS (severe acute respiratory syndrome) epidemic in 2003, the significant appreciation of the Canadian dollar between 2002 and 2008, changes in U.S. law in 2009 that led to stricter ID requirements for entry into the United States by both Canadian and U.S. citizens, and the global recession in 2008/2009. The number of tourists visiting Canada rebounded somewhat after the recession, however, reaching nearly 18 million in 2015.
Description for Chart 1
| Year | United States | Overseas | Total |
|---|---|---|---|
| millions | |||
| 1946 | 3.97 | 0.03 | 4.00 |
| 1947 | 4.30 | 0.04 | 4.34 |
| 1948 | 4.53 | 0.04 | 4.57 |
| 1949 | 4.77 | 0.04 | 4.80 |
| 1950 | 4.67 | 0.03 | 4.70 |
| 1951 | 5.04 | 0.03 | 5.07 |
| 1952 | 5.22 | 0.04 | 5.26 |
| 1953 | 5.59 | 0.04 | 5.63 |
| 1954 | 5.47 | 0.04 | 5.51 |
| 1955 | 5.65 | 0.05 | 5.70 |
| 1956 | 5.62 | 0.05 | 5.68 |
| 1957 | 5.68 | 0.06 | 5.75 |
| 1958 | 5.70 | 0.07 | 5.77 |
| 1959 | 6.30 | 0.07 | 6.36 |
| 1960 | 8.37 | 0.07 | 8.45 |
| 1961 | 8.97 | .. | .. |
| 1962 | 9.65 | .. | .. |
| 1963 | 9.93 | .. | .. |
| 1964 | 10.71 | 0.35 | 11.06 |
| 1965 | 11.38 | 0.40 | 11.78 |
| 1966 | 12.27 | 0.41 | 12.68 |
| 1967 | 14.81 | 0.59 | 15.40 |
| 1968 | 11.21 | 0.36 | 11.57 |
| 1969 | 11.77 | 0.46 | 12.23 |
| 1970 | 12.99 | 0.54 | 13.53 |
| 1971 | 13.65 | 0.54 | 14.19 |
| 1972 | 13.07 | 0.74 | 13.81 |
| 1973 | 13.52 | 0.93 | 14.45 |
| 1974 | 12.74 | 1.07 | 13.80 |
| 1975 | 12.50 | 1.16 | 13.66 |
| 1976 | 11.66 | 1.36 | 13.02 |
| 1977 | 11.45 | 1.24 | 12.69 |
| 1978 | 11.28 | 1.44 | 12.71 |
| 1979 | 10.91 | 1.71 | 12.61 |
| 1980 | 10.96 | 1.85 | 12.82 |
| 1981 | 10.97 | 1.87 | 12.84 |
| 1982 | 10.46 | 1.75 | 12.22 |
| 1983 | 10.91 | 1.61 | 12.52 |
| 1984 | 11.30 | 1.71 | 13.01 |
| 1985 | 11.56 | 1.64 | 13.20 |
| 1986 | 13.61 | 2.05 | 15.66 |
| 1987 | 12.72 | 2.30 | 15.02 |
| 1988 | 12.76 | 2.76 | 15.53 |
| 1989 | 12.18 | 2.97 | 15.16 |
| 1990 | 12.25 | 2.99 | 15.24 |
| 1991 | 12.00 | 2.94 | 14.94 |
| 1992 | 11.82 | 2.95 | 14.77 |
| 1993 | 12.02 | 3.11 | 15.14 |
| 1994 | 12.54 | 3.46 | 16.00 |
| 1995 | 13.01 | 3.96 | 16.97 |
| 1996 | 12.91 | 4.42 | 17.33 |
| 1997 | 13.40 | 4.27 | 17.67 |
| 1998 | 14.89 | 3.98 | 18.87 |
| 1999 | 15.18 | 4.23 | 19.41 |
| 2000 | 15.19 | 4.44 | 19.63 |
| 2001 | 15.57 | 4.11 | 19.68 |
| 2002 | 16.17 | 3.89 | 20.06 |
| 2003 | 14.23 | 3.30 | 17.53 |
| 2004 | 15.09 | 4.06 | 19.14 |
| 2005 | 14.39 | 4.38 | 18.77 |
| 2006 | 13.86 | 4.41 | 18.27 |
| 2007 | 13.38 | 4.56 | 17.93 |
| 2008 | 12.50 | 4.64 | 17.14 |
| 2009 | 11.67 | 4.07 | 15.74 |
| 2010 | 11.87 | 4.35 | 16.22 |
| 2011 | 11.60 | 4.42 | 16.02 |
| 2012 | 11.89 | 4.46 | 16.34 |
| 2013 | 11.48 | 4.58 | 16.06 |
| 2014 | 11.52 | 5.01 | 16.54 |
| 2015 | 12.67 | 5.31 | 17.98 |
The number of overseas tourists has grown
Historically, most tourists to Canada have come from the United States. In 1947, 98% of all tourists who visited Canada were Americans. By 1990, that share had fallen to 80%, and by 2015, Americans made up 70% of international tourists.
The decline in the share of U.S. tourists reflects significant growth in the number of overseas tourists. In each decade from 1946 to 2015, the number of overseas tourists grew at a faster rate than the number of U.S. tourists. The most notable growth in the number of overseas tourists occurred during the 1960s and 1970s. In the 1960s, growth in the number of overseas tourists averaged 23% per year, compared with almost 4% growth for American tourists.
In the 1970s, the number of overseas tourists increased by an average of nearly 14% per year, while the number of American tourists decreased every year by an average of nearly 2%. In total, the number of overseas tourists to Canada increased more than sixfold between 1960 and 1970 and by almost two-and-a-half times between 1970 and 1980. In contrast, the number of American tourists increased by 55% during the 1960s and decreased by 16% during the 1970s.
Growth in the number of overseas tourists continued to increase in the mid-1980s and well into the 1990s, averaging nearly 10% per year. During this period, the total number of overseas tourists reached 4 million for the first time. After a brief downturn in 2003, growth in the number of overseas visitors picked up again, averaging just over 4% per year after the recession. In 2014, the total number of overseas tourists reached 5 million for the first time.
Canadian trips abroad
The number of trips abroad taken by Canadians (both to the United States and overseas) more than tripled between 1946 and the recession in 1960/1961, and nearly tripled again by the late 1970s. After remaining fairly constant until the mid-1980s, the total number of Canadian trips abroad rapidly increased from 1986 until the recession in the early 1990s.
Trends in Canadian travel abroad have tended to coincide with changes in the value of the Canadian dollar. When the dollar depreciated in the 1990s, the total number of trips abroad taken by Canadians declined. However, this number began to increase again after 2002, when the Canadian dollar began a period of significant appreciation. By 2014, total trips abroad had reached a high of nearly 35 million. Since 2014, the Canadian dollar has depreciated again, coinciding with a drop in the number of Canadian tourists travelling to the United States and an overall decrease in Canadian tourist travel.

Description for Chart 2
| Year | United States | Overseas | Total |
|---|---|---|---|
| millions | |||
| 1946 | 1.60 | .. | .. |
| 1947 | 1.75 | 0.04 | 1.79 |
| 1948 | 1.57 | 0.04 | 1.62 |
| 1949 | 2.14 | 0.05 | 2.19 |
| 1950 | 2.29 | 0.06 | 2.34 |
| 1951 | 2.75 | 0.06 | 2.80 |
| 1952 | 3.25 | 0.07 | 3.32 |
| 1953 | 3.43 | 0.08 | 3.51 |
| 1954 | 3.43 | 0.10 | 3.52 |
| 1955 | 4.64 | 0.12 | 4.76 |
| 1956 | 4.79 | 0.14 | 4.93 |
| 1957 | 5.08 | 0.16 | 5.23 |
| 1958 | 5.08 | 0.17 | 5.25 |
| 1959 | 5.30 | 0.20 | 5.51 |
| 1960 | 5.33 | 0.24 | 5.57 |
| 1961 | 5.09 | 0.28 | 5.37 |
| 1962 | 4.60 | 0.31 | 4.91 |
| 1963 | 4.64 | 0.34 | 4.98 |
| 1964 | 4.79 | 0.39 | 5.19 |
| 1965 | 5.81 | 0.46 | 6.27 |
| 1966 | 6.76 | 0.50 | 7.26 |
| 1967 | 7.26 | 0.52 | 7.78 |
| 1968 | 7.90 | 0.64 | 8.54 |
| 1969 | 8.61 | 0.85 | 9.46 |
| 1970 | 8.99 | 1.10 | 10.09 |
| 1971 | 9.07 | 1.20 | 10.27 |
| 1972 | 8.65 | 1.14 | 9.79 |
| 1973 | 8.60 | 1.36 | 9.96 |
| 1974 | 8.43 | 1.43 | 9.87 |
| 1975 | 9.68 | 1.55 | 11.23 |
| 1976 | 10.96 | 1.58 | 12.54 |
| 1977 | 11.84 | 1.78 | 13.62 |
| 1978 | 11.66 | 1.81 | 13.47 |
| 1979 | 10.52 | 1.76 | 12.27 |
| 1980 | 11.24 | 1.59 | 12.82 |
| 1981 | 10.84 | 1.48 | 12.32 |
| 1982 | 10.27 | 1.49 | 11.76 |
| 1983 | 11.82 | 1.75 | 13.57 |
| 1984 | 10.89 | 2.01 | 12.90 |
| 1985 | 10.72 | 2.30 | 13.02 |
| 1986 | 10.79 | 2.28 | 13.08 |
| 1987 | 12.25 | 2.65 | 14.90 |
| 1988 | 13.70 | 2.80 | 16.50 |
| 1989 | 15.33 | 3.00 | 18.32 |
| 1990 | 17.26 | 3.15 | 20.42 |
| 1991 | 19.11 | 2.82 | 21.94 |
| 1992 | 18.60 | 3.10 | 21.70 |
| 1993 | 17.29 | 3.27 | 20.56 |
| 1994 | 14.97 | 3.37 | 18.34 |
| 1995 | 14.66 | 3.54 | 18.21 |
| 1996 | 15.30 | 3.67 | 18.97 |
| 1997 | 15.13 | 3.98 | 19.11 |
| 1998 | 13.43 | 4.22 | 17.65 |
| 1999 | 14.11 | 4.25 | 18.37 |
| 2000 | 14.67 | 4.52 | 19.18 |
| 2001 | 13.53 | 4.83 | 18.36 |
| 2002 | 13.02 | 4.68 | 17.70 |
| 2003 | 12.67 | 5.07 | 17.74 |
| 2004 | 13.86 | 5.74 | 19.60 |
| 2005 | 14.86 | 6.24 | 21.10 |
| 2006 | 15.99 | 6.74 | 22.73 |
| 2007 | 17.76 | 7.40 | 25.16 |
| 2008 | 18.91 | 8.12 | 27.03 |
| 2009 | 17.97 | 8.23 | 26.20 |
| 2010 | 20.18 | 8.72 | 28.89 |
| 2011 | 21.34 | 9.11 | 30.45 |
| 2012 | 22.70 | 9.57 | 32.27 |
| 2013 | 23.41 | 9.59 | 33.00 |
| 2014 | 23.01 | 10.51 | 33.53 |
| 2015 | 20.70 | 11.57 | 32.27 |
In 1947, 98% of all trips that Canadians took abroad were to the United States. This share fell to 85% in 1990 and, by 2015, 64% of Canadian trips abroad were to the United States. Overseas tourism by Canadians grew at a faster rate than tourist trips to the United States. By 2003, the total number of Canadian trips overseas had reached 5 million, and by 2014, it had doubled to 10 million.
Canadian trips abroad outnumber international trips to Canada
Prior to 1978, the number of trips to Canada exceeded the number of Canadian trips abroad. The two were fairly balanced until the late 1980s when Canadian trips abroad began to outnumber international trips to Canada. The number of Canadian trips abroad exceeded the number of trips to Canada from the late 1980s to the late 1990s and again from the mid-2000s to the present. Since the end of the global recession in 2009, the number of Canadian trips abroad has been essentially double that of the number of international trips to Canada.
Number of visitors from Asia growing
Historically, overseas travellers to Canada have come predominantly from Europe, particularly from the United Kingdom, Germany and France. However, Europe’s share of overseas travellers to Canada has declined as the number of travellers from Asia and Oceania has grown rapidly.
Since 1990, most of the increase in travellers from Asia has come from China. Between 1990 and 2015, growth in the number of Chinese travellers averaged 12.3% per year. This compares with 2.6% for Asia in total and 2.1% for all overseas travellers. In 2015, China became the second-largest source of overseas travellers to Canada after the United Kingdom, edging out France. The other top five countries were France, Germany and Australia.

Description for Chart 3
| 1972 | 2015 | |
|---|---|---|
| % of total overseas travellers | ||
| Europe | 70.4 | 46.3 |
| Asia | 13.5 | 33.2 |
| Mexico, Central America and the Caribbean | 7.8 | 7.3 |
| Oceania | 3.3 | 6.7 |
| South America | 3.5 | 4.2 |
| Africa | 1.6 | 2.3 |

Description for Chart 4
| Year | Europe | Asia | Mexico, Central America and the Caribbean | Oceania | South America | Africa |
|---|---|---|---|---|---|---|
| 1972 | 100.00 | 100.00 | 100.00 | 100.00 | 100.00 | 100.00 |
| 1973 | 124.29 | 111.86 | 117.49 | 140.37 | 112.67 | 140.58 |
| 1974 | 131.48 | 137.08 | 138.22 | 179.94 | 133.44 | 178.33 |
| 1975 | 140.44 | 161.60 | 157.10 | 189.11 | 148.49 | 184.30 |
| 1976 | 165.15 | 197.09 | 176.77 | 246.69 | 184.48 | 238.03 |
| 1977 | 148.60 | 179.56 | 151.93 | 224.34 | 179.98 | 233.12 |
| 1978 | 172.48 | 227.65 | 174.56 | 269.49 | 202.07 | 252.31 |
| 1979 | 207.06 | 283.45 | 204.58 | 303.58 | 251.25 | 272.43 |
| 1980 | 216.86 | 316.57 | 245.53 | 306.69 | 294.31 | 319.11 |
| 1981 | 212.58 | 322.06 | 252.46 | 296.96 | 283.08 | 345.37 |
| 1982 | 193.87 | 297.33 | 224.42 | 301.01 | 270.02 | 356.17 |
| 1983 | 166.86 | 314.57 | 192.74 | 278.15 | 208.46 | 356.01 |
| 1984 | 174.75 | 351.05 | 206.97 | 330.19 | 189.08 | 340.10 |
| 1985 | 164.03 | 345.99 | 208.36 | 329.67 | 191.51 | 294.32 |
| 1986 | 205.37 | 464.16 | 220.40 | 404.52 | 230.50 | 314.69 |
| 1987 | 246.20 | 533.32 | 243.30 | 455.25 | 263.42 | 300.59 |
| 1988 | 278.70 | 677.51 | 306.49 | 492.98 | 332.11 | 331.34 |
| 1989 | 284.06 | 780.26 | 286.29 | 571.52 | 338.09 | 340.94 |
| 1990 | 280.05 | 791.42 | 269.04 | 564.37 | 348.13 | 358.93 |
| 1991 | 282.17 | 794.81 | 262.73 | 490.57 | 334.35 | 337.70 |
| 1992 | 291.87 | 804.63 | 266.91 | 502.97 | 273.33 | 350.84 |
| 1993 | 316.56 | 815.98 | 280.68 | 468.30 | 284.60 | 354.48 |
| 1994 | 329.96 | 966.89 | 291.31 | 554.97 | 317.74 | 371.23 |
| 1995 | 361.30 | 1,207.60 | 275.81 | 661.10 | 397.33 | 357.08 |
| 1996 | 388.86 | 1,394.39 | 310.37 | 697.47 | 444.71 | 403.07 |
| 1997 | 380.27 | 1,261.62 | 325.27 | 724.97 | 429.53 | 424.78 |
| 1998 | 371.22 | 992.11 | 355.48 | 681.59 | 417.58 | 428.66 |
| 1999 | 386.56 | 1,067.96 | 397.28 | 701.74 | 377.48 | 472.57 |
| 2000 | 399.81 | 1,140.07 | 422.93 | 750.81 | 400.74 | 520.76 |
| 2001 | 365.75 | 1,038.93 | 430.48 | 707.97 | 342.60 | 495.31 |
| 2002 | 328.20 | 1,034.55 | 451.79 | 673.21 | 310.53 | 437.98 |
| 2003 | 292.73 | 759.13 | 401.55 | 643.89 | 249.82 | 425.55 |
| 2004 | 348.37 | 1,046.68 | 474.22 | 767.35 | 337.00 | 479.03 |
| 2005 | 373.48 | 1,086.96 | 503.31 | 861.79 | 420.25 | 506.02 |
| 2006 | 367.47 | 1,092.12 | 541.09 | 847.74 | 454.15 | 585.41 |
| 2007 | 382.51 | 1,075.83 | 603.30 | 941.28 | 489.07 | 609.65 |
| 2008 | 392.23 | 1,040.91 | 639.76 | 1,026.16 | 523.73 | 643.08 |
| 2009 | 354.49 | 890.74 | 483.24 | 885.00 | 473.59 | 610.74 |
| 2010 | 372.31 | 1,012.01 | 422.93 | 1,004.76 | 554.42 | 660.00 |
| 2011 | 368.10 | 1,065.69 | 438.16 | 1,025.09 | 585.53 | 675.06 |
| 2012 | 361.12 | 1,118.77 | 456.14 | 1,101.58 | 627.61 | 728.87 |
| 2013 | 359.11 | 1,209.31 | 473.94 | 1,139.99 | 639.60 | 785.53 |
| 2014 | 385.50 | 1,411.48 | 518.88 | 1,218.50 | 654.54 | 842.48 |
| 2015 | 400.36 | 1,503.58 | 570.35 | 1,252.09 | 738.09 | 883.79 |
Definitions
International traveller: All persons arriving in Canada who are cleared through Canada Border Services Agency points of entry, divided into three mutually exclusive groups: non-resident traveller (traveller residing in a country other than Canada arriving in Canada), resident traveller (traveller residing in Canada returning from outside of Canada) and other traveller (e.g., crews and immigrants). Figures for other travellers are excluded for the purposes of this paper. The duration of the travel must be for a period of less than one year.
International tourist: An international traveller taking at least an overnight trip.
Overseas traveller: A traveller to Canada from a country other than the United States.
Canadian trips abroad: Measured as the number of Canadian tourists returning from travel to other countries.
References
Statistics Canada, Travel Between Canada and Other Countries, various years (1946 to 1971).
Statistics Canada, Travel Between Canada and Other Countries, 1972, Part II, International Travel Statistics 1968 to 1972, pages 71 to 77.
Contact Information
To enquire about the concepts, methods or data quality of this release, contact Sean Clarke ([email protected]; 613-796-9238), Analytical Studies Branch.
link
More Stories
2026 Shropshire Business Awards: A Renewed Focus on Tourism and Innovation
IS YOUR BUSINESS VISITOR READY?
2026 Tourism Climate Adaptation and Environmental Sustainability Business Survey Launches – Destination BC